Why Animal Sheltering Organizations See Different Data Trends Locally vs. Nationally
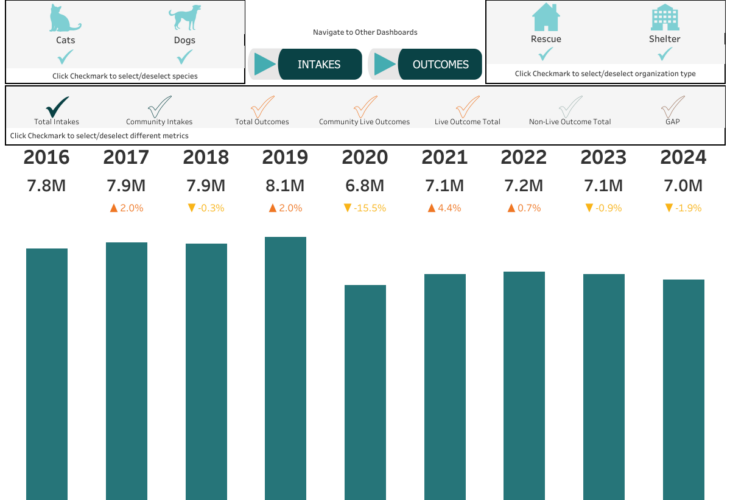
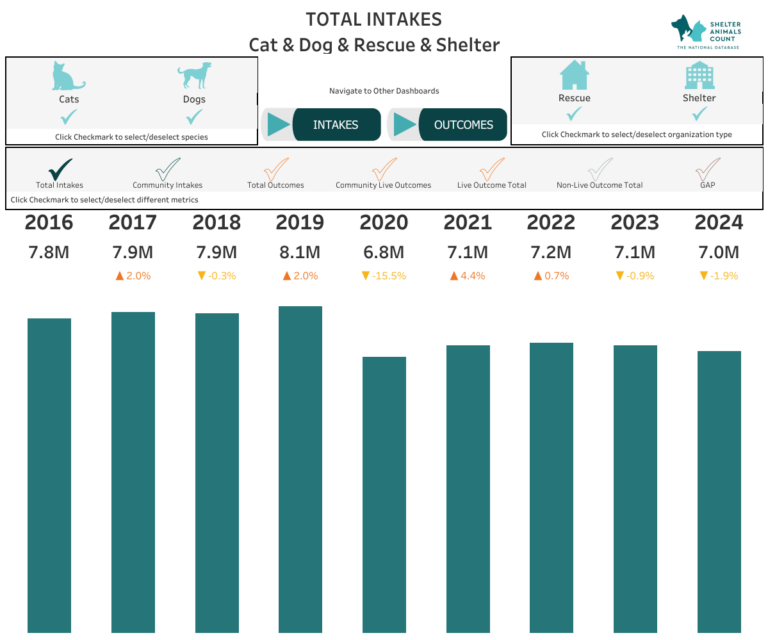
Shelter Animals Count recently released our 2024 Year End Report, showcasing national data trends from 13,000+ shelters and rescue organizations. National trends offer a broad perspective, helping us identify industry-wide shifts, challenges, and opportunities. But when individual organizations compare their own data to these national patterns, the differences can be stark—and sometimes puzzling.
Understanding why your organization’s data may diverge from national trends isn’t just interesting—it’s empowering. These insights can help you refine your strategies, strengthen your impact, and contribute more effectively to the animal welfare ecosystem.
Digging Deeper Into the Difference
Let’s explore the key reasons why your trends might differ from the national average and how to leverage that knowledge.
1. Regional and Local Differences
Your community’s unique demographics, economic conditions, and available resources play a huge role in shaping your organization’s trends. For instance, areas with limited access to affordable veterinary care might see higher surrender rates, while those with robust support networks could experience lower intake numbers.
Action Step: Map out local factors affecting your data. Are there unmet needs in your area that you could address to drive desired outcomes?
2. Industry-Specific Focus
Specialization matters. Organizations focusing on specific challenges—like large-breed dogs, neonatal kittens, or equines—often experience trends that deviate from the national averages. National data aggregates are helpful, but they may not fully represent the nuances of your specialized work.
Action Step: Check this out: Shelter Animals Count offers a Coalition Builder, a tool that fosters collaboration and data tracking among animal welfare agencies at local, regional, and national levels. Using this tool can help specialized organizations track certain populations and share data with each other.
3. Operational Strategies and Goals
Your organization’s mission, resources, and approach directly influence your trends. For example, proactive spay/neuter programs or innovative foster initiatives can dramatically affect intake and outcome patterns.
Action Step: Set data-driven goals aligned with your operational
strategy, and monitor how changes impact your outcomes.
4. Local Competitive Landscape
The dynamics of your local animal welfare ecosystem can significantly shape your results. An organization in a crowded market may face tougher competition for adopters, while another in an underserved area might be the community’s only resource.
Action Step: Collaborate with nearby organizations to share
insights, identify gaps, and collectively improve animal outcomes.
5. External Events
From disease outbreaks to natural disasters, unforeseen events can skew trends in ways that national data may not immediately capture.
Action Step: Build flexibility into your operations to adapt to
emergencies and monitor their long-term effects on your data.
Why Local Data Matters as Much as National Data
While national trends are vital for providing context and direction, local data is where actionable insights live. By pairing your organization’s unique data with national benchmarks, you gain a clearer understanding of how your efforts fit into the bigger picture.
Collaborate, Compare, and Contribute
Shelter Animals Count exists to empower you with tools to analyze your data, compare it to meaningful benchmarks, and contribute to a collective understanding of the animal welfare industry. When every organization shares their data, the entire industry benefits.
Call to Action: Let’s Make 2025 a Year of Informed Impact
Ready to dive deeper into your data? Join us as we work together to elevate the entire animal welfare field. Here’s how you can get involved:
Shelter Animals Count just released our refreshed version of our National Animal Welfare Statistics Dashboard
1. Share Your Data: If you’re not already contributing, start submitting your data today! Every number tells a story that helps shape the national narrative.
3. Sign up for our APIs: Don’t forget that you can sign up for our APIs that will automatically transfer your data every month.
4. Engage with Us: Attend our upcoming webinars and events, including our 2024 Year-End Review webinar on February 12th at Noon EST to sharpen your data-driven strategies.