cats and dogs entered shelters and rescues across America.
2.9 million cats
2.9 million dogs
This marks a 1% decrease from 2023 and an 11% decrease from 2019.
In 2024, community intakes for dogs and cats totaled 1.4% fewer than in 2023, representing 83,000 fewer animals. Intakes are evenly split between dogs and cats, with both contributing to the overall decline. However, dog intakes saw a more significant decrease compared to cats.
Intakes have declined by 11% (735,000 animals) since 2019. This larger gap suggests a shift in community dynamics
Of the animals in shelters and rescues in 2024,
4.1 million
were adopted into loving homes.
2 million cats
2 million dogs
Dog adoption rates (percentage of adoptions relative to intakes) have increased 56% in 2023 to 57% in 2024. Cat adoption rates remained high at 64% in 2024 (compared to 62% in 2023 and 57% in 2019).
In 2024, total adoptions for dogs and cats reached 4,192,443 (2M dogs and 2M cats), a slight 0.4% increase (17,153 more adoptions) from 2023 but still 5.6% lower than 2019, with over 250,000 fewer animals finding homes since then.
Dog adoptions continued to decline, dropping 1% (nearly 22,000 fewer adoptions) from 2023 and 13% (308,000 fewer adoptions) since 2019. Conversely, cat adoptions grew 2% (nearly 39,000 more adoptions) over 2023 and surpassed 2019 levels by 3% (57,000 additional adoptions), with peak growth during summer months.
This highlights the ongoing challenge of declining dog adoption numbers while building on gains in cat adoptions.
(includes euthanasia, lost and died in care, etc.)
102000
Animals added to shelter populations at the end of 2024
Live community outcomes are down by 0.4% compared to 2023 - around 20,000 animals.
Dogs accounted for 2.6 million of these live community outcomes (outcomes excluding transfers), marking a decrease of nearly 2% (46,000) from 2023 and a more significant drop of 15.8% (490,000) compared to 2019. In 2019, dogs comprised 55% of all community live outcomes, but by 2024, their share has declined to 50%. In contrast, cats also achieved 2.6 million live outcomes in 2024, an increase of 1% (26,000) from 2023 and 2% (51,000) from 2019, reflecting a steady upward trend in positive outcomes for cats in recent years.
607,000
total animals were euthanized in 2024.
334,000
dogs euthanized
273,000
cats euthanized
Non-live outcomes decreased by 2% (12,300 animals) compared to
2023, but are still 20% lower than 2019 (255,000 animals).
Non-live outcomes in shelters have risen by 0.5% for dogs but dropped by 15% for cats. The increase for dogs is driven by government organizations, where non-live outcomes grew by 1.5%, now standing 17.5% higher than in 2019, with a non-live outcome rate of 15% of total intakes. For cats, all shelter types have seen declines in non-live outcomes. Rescues also reported decreases, with non-live outcomes down 15% for dogs and 4.6% for cats.
1,189,000
dogs and cats transferred IN to sheltering organizations in 2024.
In 2024, transfers into organizations dropped 4.1% compared to 2023, with 680,000 dogs (down 5.6%) and 510,000 cats (down 2.2%) transferred. Transfers in, which may include non-sheltering sources, remain a vital intake type for many organizations.
893,000
dogs and cats transferred OUT to sheltering organizations in 2024.
Transfers out continued to decline in 2024, with 524,000 dogs (down 4.5% from 2023 and 37.6% from 2019) and 369,000 cats (down 3.7% from 2023 and 27% from 2019) moved within the sheltering system. Overall, transfers for dogs and cats dropped 4.1% from 2023 and 33.6% from 2019, highlighting systemic challenges like reduced resources and capacity, underscoring the need for collaboration and strategic planning.
There are
13,527
animal-sheltering organizations in America.
The majority (85%) of community intakes occur in shelters, with 15% coming from rescues.
9417
RESCUES
Organizations without a Government Contract
4110
SHELTERS
Government Animal Services, Shelters With and Without Government Contracts
Dig Into Historical Data with our National Animal Welfare Statistics Dashboard
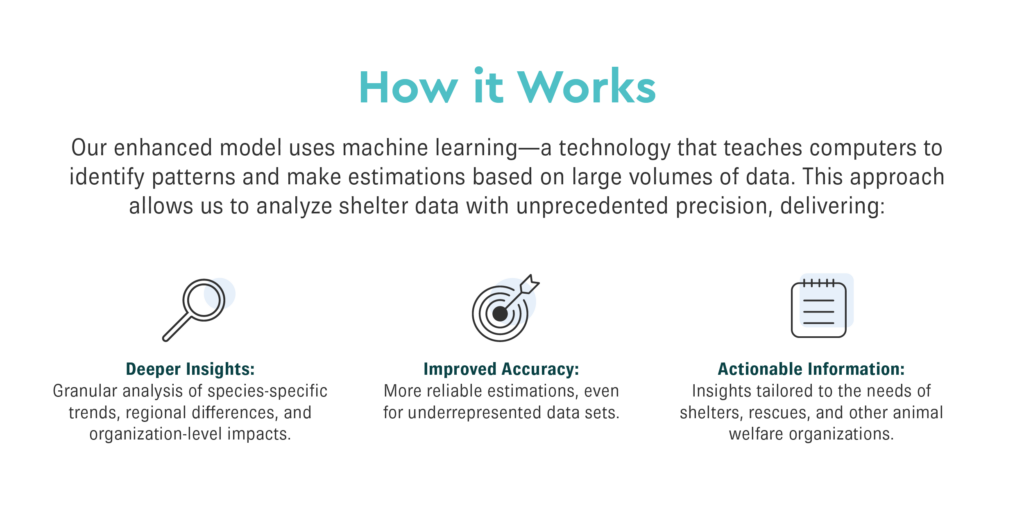
The National Animal Welfare Statistics Dashboard provides aggregate data on the total number of dogs and cats entering and leaving organizations across the country. These national estimates are created using collected data from over 6,000 organizations from 2016-2024.
In 2024, SAC released national estimates based on organization and species-level medians. While these estimates were thoroughly validated and instrumental in identifying high-level trends, we recognized an opportunity to deepen our analysis. The updated model enables a more nuanced understanding of the data, helping us uncover patterns and insights that can drive significant improvements in animal welfare outcomes.

")


")