Metro and Non-Metro Shelter Data: Insights from SAC's 2024 Year-End Analysis - Shelter Animals Count
- Home
- Metro and Non-Metro Shelter Data: Insights from SAC’s 2024 Year-End Analysis
02Apr’25
Metro and Non-Metro Shelter Data
Insights from Shelter Animals Count’s 2024 Year-End Analysis
Animal shelters and rescues across the United States operate in different environments depending on their geographic location. Using data from our Shelter Animals Count (SAC) 2024 Year End Report, we analyzed key differences between shelters and rescues in metro versus non-metro areas, shedding light on intake trends, adoption rates, and population shifts. Understanding these distinctions helps us better address the needs of animals in both urban and rural communities.
Breaking Down the Numbers
Shelter Animals Count categorizes metro and non-metro counties based on the 2023 Rural Urban Continuum Codes (RUCC) established by the USDA. This classification helps distinguish urban areas with large populations and high commuting activity from more rural, sparsely populated regions.
Our data analysis, based on our scientific model, examines organizations operating in these distinct regions to explore how geography impacts animal welfare trends.
Total organizations: 13,527
- Metro: 10,716 (79%)
- Non-Metro: 2,811 (21%)
Shelter organizations: 4,110
- Metro: 2,607 (63%)
- Non-Metro: 1,503 (37%)
Rescue organizations: 9,417
- Metro: 8,109 (86%)
- Non-Metro: 1,308 (14%)
While metro counties host the majority of organizations, non-metro areas have a higher proportion of shelters compared to rescues.
Intakes and Outcomes: Metro vs. Non-Metro Trends
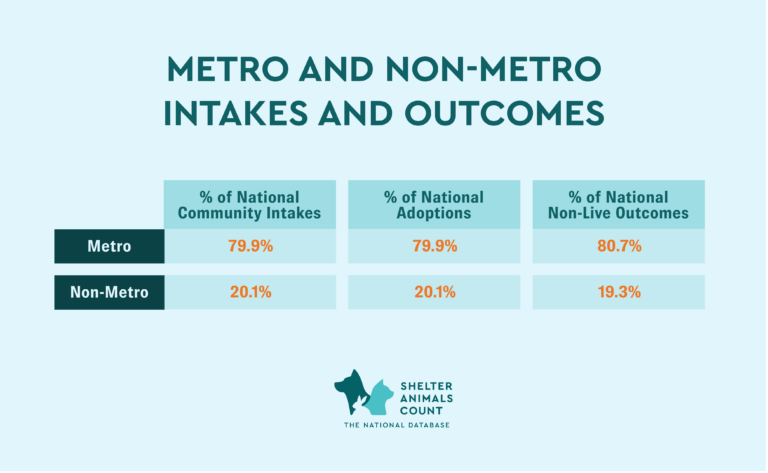
The distribution of national adoptions and non-live outcomes mirrors the distribution of intakes between metro and non-metro counties, with metro areas accounting for about 80% of all cases.
Metro Counties: Stability with Shifting Outcomes
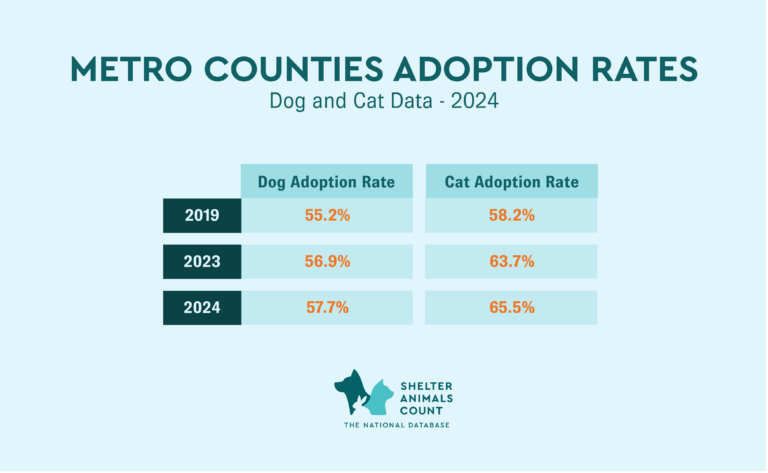
Metro areas have experienced relatively stable population balance percentages (PBC) for both dogs and cats between 2019 and 2024. However, key trends have emerged:
- Intakes: Metro counties saw a slight decline in community intakes (-1.1% for dogs, -0.3% for cats).
- Adoptions: Dog adoptions declined by 0.6% in 2024 compared to 2023 and are still 13.1% lower than 2019. Cat adoptions have increased from both 2023 (+2.2%) and 2019 (+3%). However, adoption rates (adoptions % of total intakes) in Metro counties are rising for both dogs and cats.
- Non-Live Outcomes: Dog non-live outcomes increased by 0.5% from 2023 and are 11% higher than in 2019. Conversely, cat non-live outcomes decreased by 2.1% from 2023 and are 36.4% lower than in 2019.
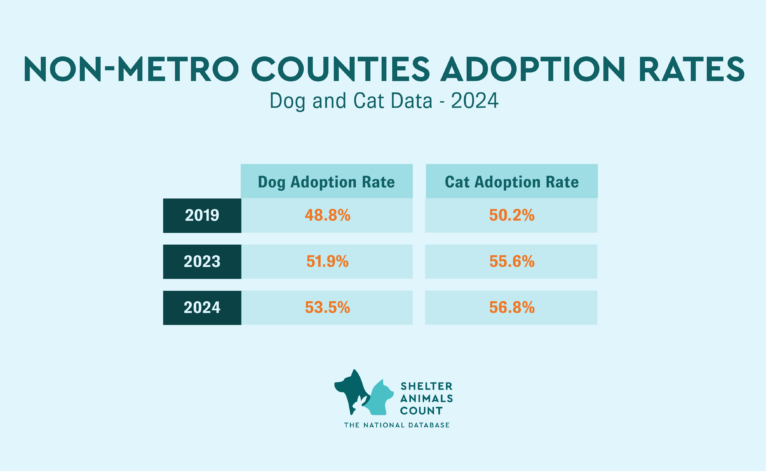
Non-Metro Counties: More Fluctuation, Lower Adoption Rates
Non-metro counties show greater variation in intake and outcome trends, especially in cat populations:
- Intakes: Community intakes declined more sharply than in metro areas (-5.9% for dogs, -2% for cats).
- Adoptions: Adoption rates remain lower than in metro counties, though they are increasing over time. Dog adoptions dropped 2.9% from 2023, while cat adoptions remained stable.
- Non-Live Outcomes: Dog non-live outcomes declined by 5% in 2024 but remain 3.4% higher than in 2019. Cat non-live outcomes saw a significant drop (-4.9% from 2023, -41.3% from 2019).
Key Takeaways and What This Means for Animal Welfare
- + Metro shelters and rescues are seeing improving adoption rates, especially for cats, but non-live outcomes for dogs are rising.
- + Non-metro organizations face greater fluctuation in intake numbers and tend to have lower adoption rates.
- + Animals in non-metro areas are more likely to experience longer wait times for outcomes compared to metro counterparts.
By identifying these differences, we can better support organizations based on their regional needs. Increased transport partnerships, targeted adoption campaigns, and resource allocation for non-metro shelters could help bridge the gap between urban and rural animal welfare efforts.
Data-driven insights like these allow us to work smarter in addressing the challenges that shelters and rescues face. By continuing to analyze and respond to trends, we can ensure better outcomes for animals—no matter where they are.
Resources
National State Data Dashboard – Visit our dashboard for state-level analysis
Coalitions through Shelter Animals Count – Coalitions through SAC are used by funders, state federations, local groups, etc. in order to have access to data. They utilize the SAC platform to gain access to data submitted to Shelter Animals Count, saving organizations time reporting to multiple places.
